Network map widget
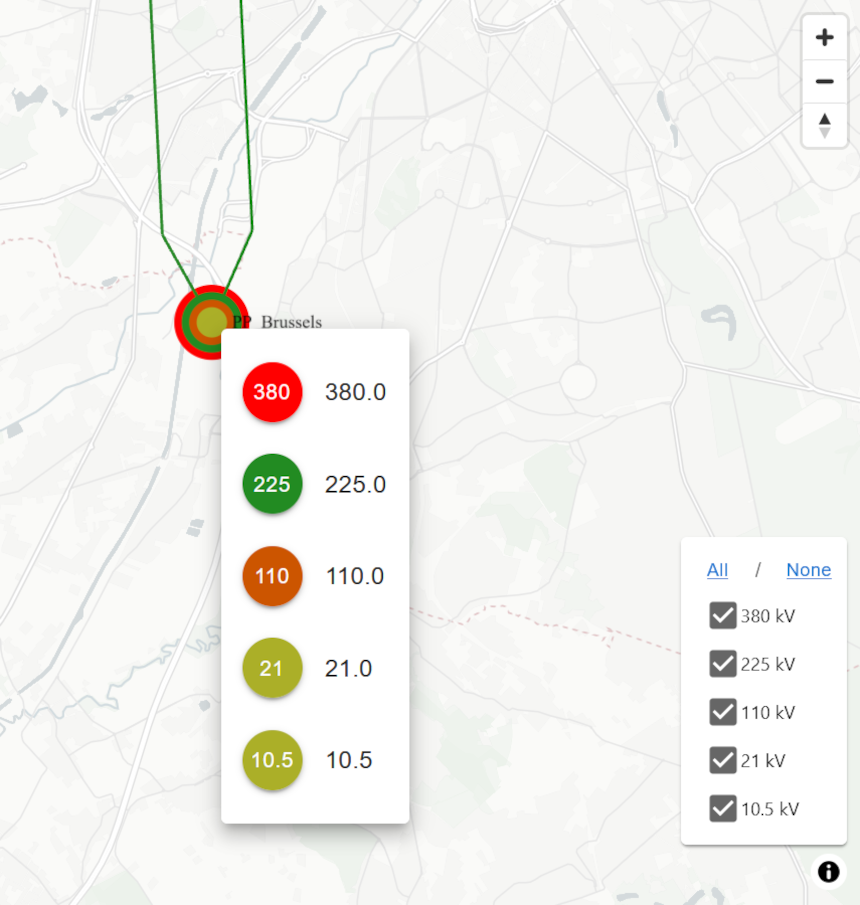
Network map is an interactive widget that displays a network’s substations and lines on a map. If the network does not contain geo data (in its substation’s and line’s IIDM extensions), the map will be empty. The widget allows you to pan and zoom the map. A filter on the network’s nominal voltages list can be used to improve the readability of the map, in case of a large network.
The following code, to be run in a notebook, first creates a network, then displays the Network map widget on it.
Please note that substation’s and line’s IIDM extensions are only available in PyPowSyBl starting from v1.5.0; With earlier versions of PyPowSyBl the map would be empty.
import pypowsybl.network as pn
from pypowsybl_jupyter import NetworkMapWidget

# load a CGMES file containing a GL profile (Graphical Layout) and run a LF
network1 = pn.load('./data/MicroGridTestConfiguration_T4_BE_BB_Complete_v2.zip', {'iidm.import.cgmes.post-processors': 'cgmesGLImport'})

NetworkMapWidget(network1)

A click on a substation pops up a list of its VL.
Widget API
NetworkMapWidget(network:Network, sub_id:str = None, use_name:bool = True, display_lines:bool = True, use_line_geodata:bool = False, nominal_voltages_top_tiers_filter = -1, dark_mode:bool = False, on_hover_func: OnHoverFuncType = None) -> NetworkMapWidget
network: the input network.
sub_id: if not None, centers the network on the substation with the given substation id. Default is None.
use_name: When True (default) the widget displays network’s elements names (if available, otherwise their ids); When False, the widget displays network’s elements ids.
display_lines: When True (default) the network lines are displayed on the map. When false, the widget displays only the substations.
use_line_geodata: When False (default) the widget does not use the network’s line geodata extensions; Each line is drawn as a straight line connecting two substations.
nominal_voltages_top_tiers_filter: filters the elements in the map based on the network’s top nominal voltages. N displays the top n nominal voltages; -1 (default) displays all.
dark_mode: When True, sets the widget’s display theme to dark (default is False).
on_hover_func: a callback function that is invoked when hovering on the network equipments. The function parameters (OnHoverFuncType = Callable[[str], str]) is the line id; It must return an HTML string. None disables the hovering feature. Note that currently the map viewer component supports hovering on lines.
Customize widget’s interactions
It is possible to customize the widget’s behaviour when one entry is clicked in a substation’s voltage levels popup. This feature could be used to create more complex interactions (e.g., by integrating other widgets).
Use these widget’s method to register a callback on a specific event:
on_selectvl
The network explorer demonstrates the approach.
Example: the code below activate a callback when a VL entry is clicked in the VL list popup. This example just prints the voltage level.
map_widget = NetworkMapWidget(network)
map_widget.on_selectvl(lambda event : print_infos('Selected VL : ' + event.selected_vl))