SLD widget
SLD is an interactive widget that displays a Single Line Diagram SVG, generated for example using the PyPowSyBl APIs, in a Jupyter notebook The widget allows you to pan and zoom the diagram, to focus on a specific part when the network is large.
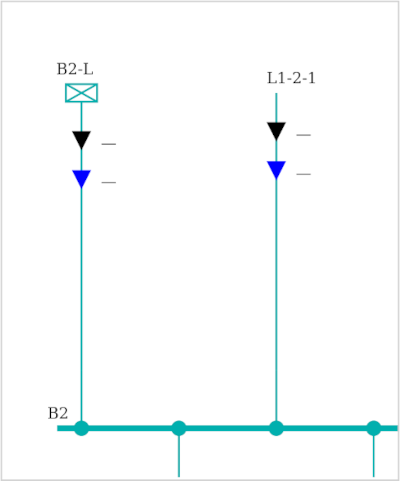
The following code, to be run in a notebook, first creates a network, then displays the SLD widget on it.
import pypowsybl.network as pn
from pypowsybl_jupyter import display_sld

network = pn.create_ieee14()
vl=network.get_voltage_levels().index[1]

sld=display_sld(network.get_single_line_diagram(vl))
display(sld)
Update the widget
It is possible to update the widget’s content through the update_sld API. The code below updates the sld widget already displayed, with a new VL.
from pypowsybl_jupyter import update_sld

vl1=network.get_voltage_levels().index[5]

update_sld(sld, network.get_single_line_diagram(vl1))
Widget API
display_sld(svg, enable_callbacks: bool = False, invalid_lf: bool = False, on_hover_func: OnHoverFuncType = None) -> SldWidget:
svg: the input SVG, as str or class providing an svg and metadata representation.
enable_callbacks: if true, enable the callbacks for navigation arrows, feeders and switches.
invalid_lf: when True the opacity style for some of the displayed info’s (e.g., active and reactive power) is decreased, making them barely visible in the diagram.
on_hover_func: a callback function that is invoked when hovering on equipments. The function parameters (OnHoverFuncType = Callable[[str, str], str]) are the equipment id and type; It must return an HTML string. None disables the hovering feature.
update_sld(sldwidget, svg, keep_viewbox: bool = False, enable_callbacks: bool = False, invalid_lf: bool = False)
sldwidget: the existing widget to update.
svg: the input NAD’s SVG.
keep_viewbox: if True, keeps the current pan and zoom after the update.
enable_callbacks: if True, enable the callbacks for navigation arrows, feeders and switches.
invalid_lf: when True the opacity style for some of the displayed info’s (e.g., active and reactive power) is decreased, making them barely visible in the diagram.
Customize widget’s interactions
By default, only the pan and zoom interactions with the diagram are active.
It is possible to customize the widget’s behaviour when some of the displayed elements are clicked (e.g., a switch or a VL’s arrow) to create more complex interactions (e.g., by integrating other widgets).
Use these widget’s methods to register a callback on a specific event:
on_nextvl
on_switch
on_feeder
on_bus
The network explorer demonstrate the approach.
Example: the code below activate a callback when a VL arrow is clicked in the widget. Each time an arrow is clicked, the next VL’s id is printed in the log.
def vl_callback_demo(event):
        print('Clicked a VL arrow, next VL is: ' + event.clicked_nextvl)

sld_widget=display_sld(network.get_single_line_diagram(network.get_voltage_levels().index[1]), enable_callbacks=True)
sld_widget.on_nextvl(vl_callback_demo)
display(sld_widget)