Network map widget#
Network map is an interactive widget that displays a network’s substations and lines on a map. If the network does not contain geo data (in its substation’s and line’s IIDM extensions), the map will be empty. The widget allows you to pan and zoom the map. A filter on the network’s nominal voltages list can be used to improve the readability of the map, in case of a large network.
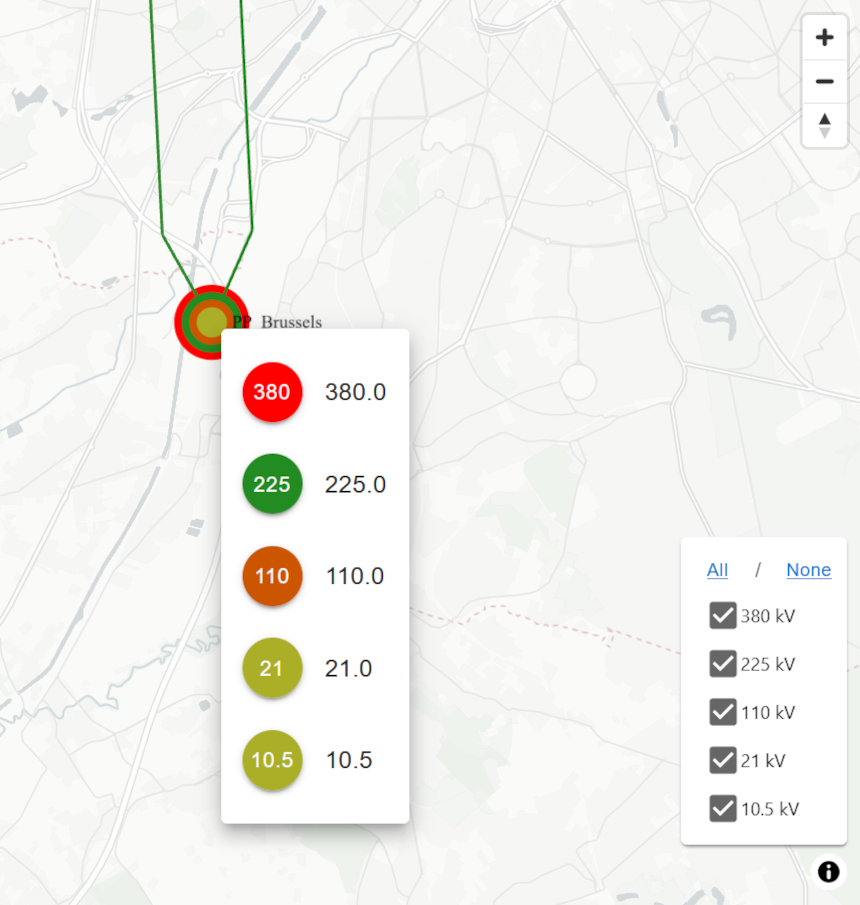
The following code, to be run in a notebook, first creates a network, then displays the Network map widget on it.
Please note that substation’s and line’s IIDM extensions are only available in PyPowSyBl starting from v1.5.0; With earlier versions of PyPowSyBl the map would be empty.
import pypowsybl.network as pn
from pypowsybl_jupyter import NetworkMapWidget

# load a CGMES file containing a GL profile (Graphical Layout) and run a LF
network1 = pn.load('./data/MicroGridTestConfiguration_T4_BE_BB_Complete_v2.zip', {'iidm.import.cgmes.post-processors': 'cgmesGLImport'})

NetworkMapWidget(network1)

A click on a substation pops up a list of its VL.
Widget API#
NetworkMapWidget(network:Network, sub_id:str = None, use_name:bool = True, display_lines:bool = True, use_line_geodata:bool = False, nominal_voltages_top_tiers_filter = -1, dark_mode:bool = False, on_hover_func: OnHoverFuncType = None) -> NetworkMapWidget
network: the input network.
sub_id: if not None, centers the network on the substation with the given substation id. Default is None.
use_name: When True (default) the widget displays network’s elements names (if available, otherwise their ids); When False, the widget displays network’s elements ids.
display_lines: When True (default) the network lines are displayed on the map. When false, the widget displays only the substations.
use_line_geodata: When False (default) the widget does not use the network’s line geodata extensions; Each line is drawn as a straight line connecting two substations.
nominal_voltages_top_tiers_filter: filters the elements in the map based on the network’s top nominal voltages. N displays the top n nominal voltages; -1 (default) displays all.
dark_mode: When True, sets the widget’s display theme to dark (default is False).
on_hover_func: a callback function that is invoked when hovering on the network equipments. The function parameters (OnHoverFuncType = Callable[[str], str]) is the line id; It must return an HTML string. None disables the hovering feature. Note that currently the map viewer component supports hovering on lines.
Customize widget’s interactions#
It is possible to customize the widget’s behaviour when one entry is clicked in a substation’s voltage levels popup. This feature could be used to create more complex interactions (e.g., by integrating other widgets).
Use these widget’s method to register a callback on a specific event:
on_selectvl
The network explorer demonstrates the approach.
Example: the code below activate a callback when a VL entry is clicked in the VL list popup. This example just prints the voltage level.
map_widget = NetworkMapWidget(network)
map_widget.on_selectvl(lambda event : print_infos('Selected VL : ' + event.selected_vl))