SLD widget#
SLD is an interactive widget that displays a Single Line Diagram SVG, generated for example using the PyPowSyBl APIs, in a Jupyter notebook The widget allows you to pan and zoom the diagram, to focus on a specific part when the network is large.
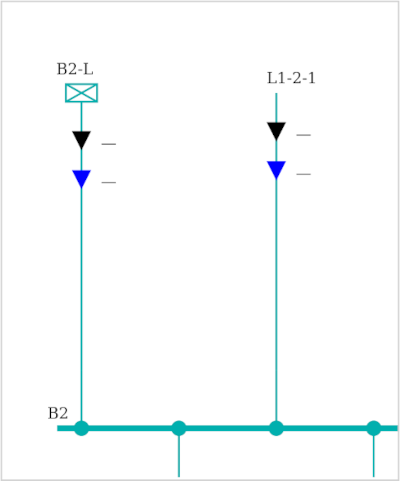
The following code, to be run in a notebook, first creates a network, then displays the SLD widget on it.
import pypowsybl.network as pn
from pypowsybl_jupyter import display_sld

network = pn.create_ieee14()
vl=network.get_voltage_levels().index[1]

sld=display_sld(network.get_single_line_diagram(vl))
display(sld)
Update the widget#
It is possible to update the widget’s content through the update_sld API. The code below updates the sld widget already displayed, with a new VL.
from pypowsybl_jupyter import update_sld

vl1=network.get_voltage_levels().index[5]

update_sld(sld, network.get_single_line_diagram(vl1))
Widget API#
display_sld(svg, enable_callbacks: bool = False, invalid_lf: bool = False, on_hover_func: OnHoverFuncType = None) -> SldWidget:
svg: the input SVG, as str or class providing an svg and metadata representation.
enable_callbacks: if true, enable the callbacks for navigation arrows, feeders and switches.
invalid_lf: when True the opacity style for some of the displayed info’s (e.g., active and reactive power) is decreased, making them barely visible in the diagram.
on_hover_func: a callback function that is invoked when hovering on equipments. The function parameters (OnHoverFuncType = Callable[[str, str], str]) are the equipment id and type; It must return an HTML string. None disables the hovering feature.
update_sld(sldwidget, svg, keep_viewbox: bool = False, enable_callbacks: bool = False, invalid_lf: bool = False)
sldwidget: the existing widget to update.
svg: the input NAD’s SVG.
keep_viewbox: if True, keeps the current pan and zoom after the update.
enable_callbacks: if True, enable the callbacks for navigation arrows, feeders and switches.
invalid_lf: when True the opacity style for some of the displayed info’s (e.g., active and reactive power) is decreased, making them barely visible in the diagram.
Customize widget’s interactions#
By default, only the pan and zoom interactions with the diagram are active.
It is possible to customize the widget’s behaviour when some of the displayed elements are clicked (e.g., a switch or a VL’s arrow) to create more complex interactions (e.g., by integrating other widgets).
Use these widget’s methods to register a callback on a specific event:
on_nextvl
on_switch
on_feeder
on_bus
The network explorer demonstrate the approach.
Example: the code below activate a callback when a VL arrow is clicked in the widget. Each time an arrow is clicked, the next VL’s id is printed in the log.
def vl_callback_demo(event):
        print('Clicked a VL arrow, next VL is: ' + event.clicked_nextvl)

sld_widget=display_sld(network.get_single_line_diagram(network.get_voltage_levels().index[1]), enable_callbacks=True)
sld_widget.on_nextvl(vl_callback_demo)
display(sld_widget)